
Where it all started...
With Warden IAM, we answered one of the most difficult questions in managing identities and permissions of your cloud infrastructure: “who has access to your most sensitive resources?” The natural follow-up question you would be thinking of is “how was the access granted?” And this question is never straightforward to be answered, especially without complex tracing and tooling in place.
Access graphs to the rescue
“Defenders think in lists. Attackers think in graphs. As long as this is true, attackers win.” - John Lambert from Microsoft.
With Warden IAM’s Graph Visualization, you can easily uncover not-so-obvious intricate identities and entitlement patterns, making fraud evasion harder. Access graphs can be helpful for early fraud detection, as cybersecurity data from various sources is displayed visually and intuitively. Using graphs, charts, and real-time dashboards, as a security professional, you can reduce clutter, making it simpler to spot anomalies. Instead of digging via multiple logs or reports, using a graphical visualization makes the most vital threat indicators apparent.
How does it work
With Access Graphs in place, Warden breaks down the complex access granting layers and puts them into simple visualization. These visualizations are not only pleasing for your eyes, but they also help you understand exact access paths and spot any potential risks in the following ways:
- To accurately answer the question “How was the access granted?”
- To help you investigate excessive permissions and security threats without wrecking precious hours of communication among team members, or digging through multiple consoles
- To spot any overlapping, duplicated, or excessive permissions at a glance from the graph
- To zoom in and highlight a specific access path that you would like to present or investigate further
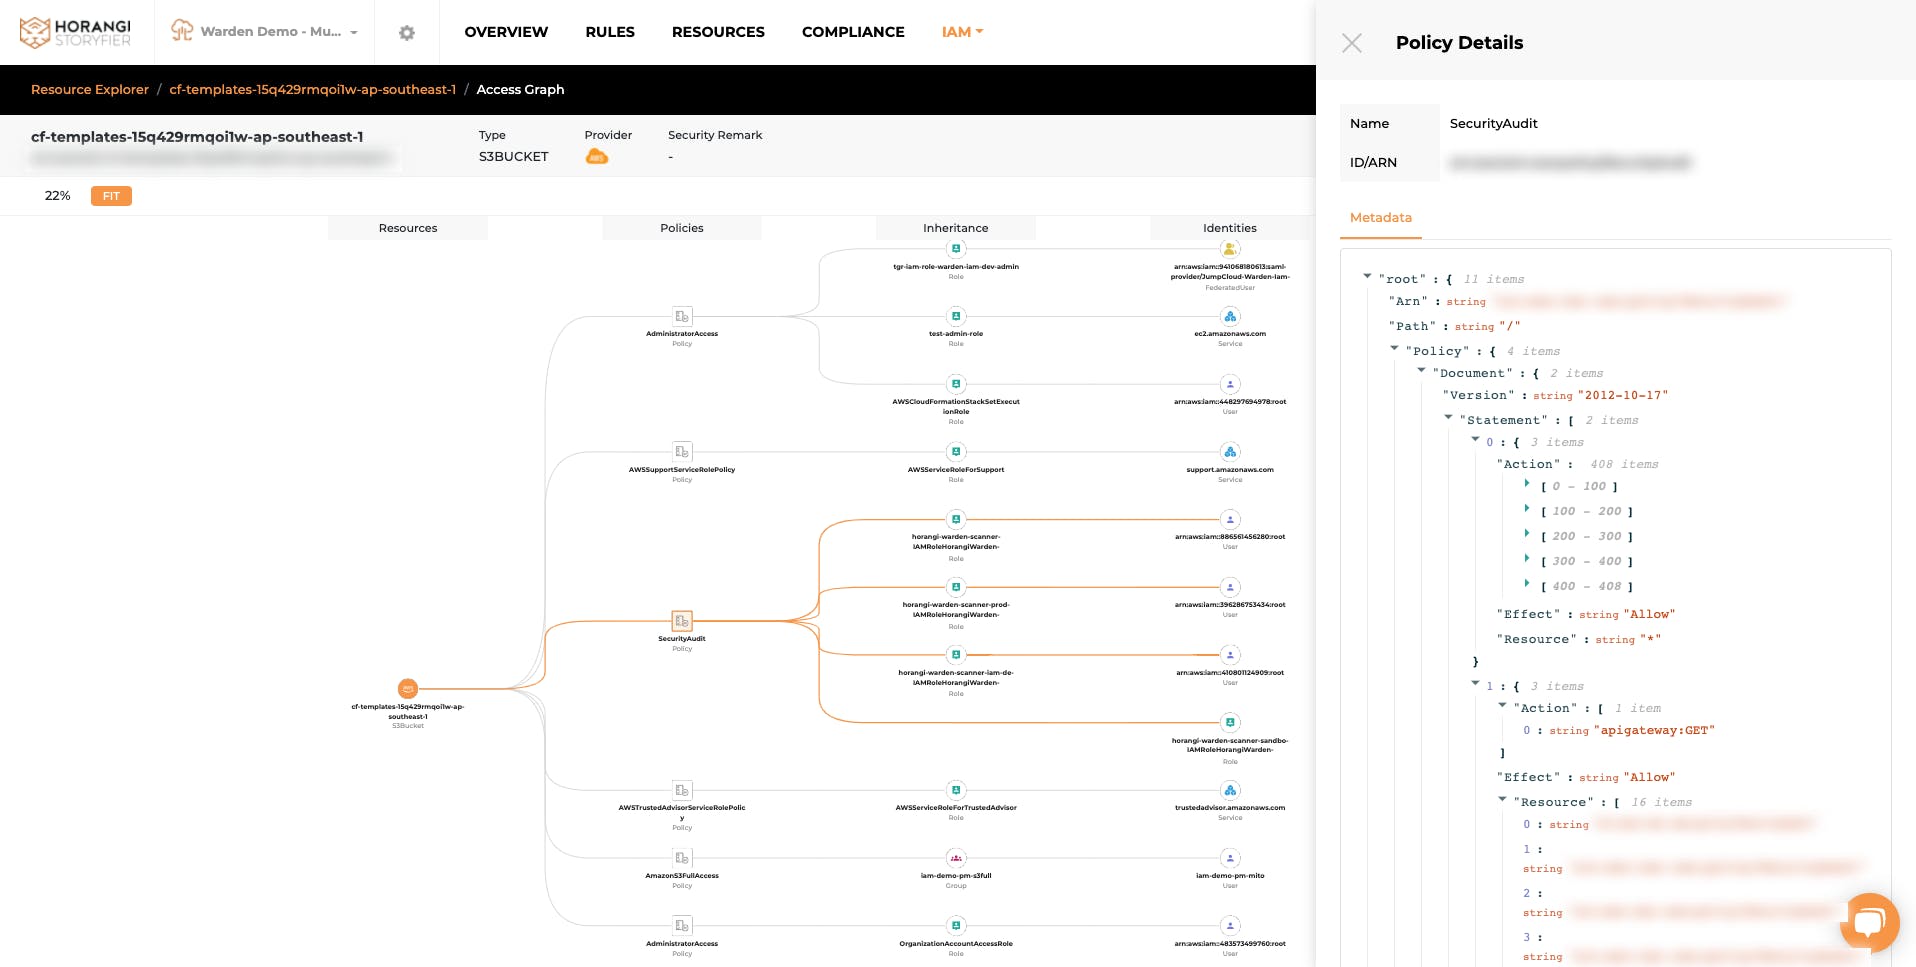
Here’s an example
What does it show: This graph below is an example of how you can easily spot any duplication of similar roles being assigned to 3 similar external users on the same S3 bucket instance.
Inferences to take action: Your team can immediately dive into reviewing the permissions granted by clicking into each role and removing the duplicated and over permissive permissions among them.
The objective it fulfills: After carefully reviewing and remediating excessive permissions, it will become easy to catch and fix them before they escalate. It will also help you in enforcing the principle of least privilege access, and protect your crown jewels. Graph Visualization can also help you in minimizing your attack surface and potentially help reduce overhead cost in your cloud infrastructure.
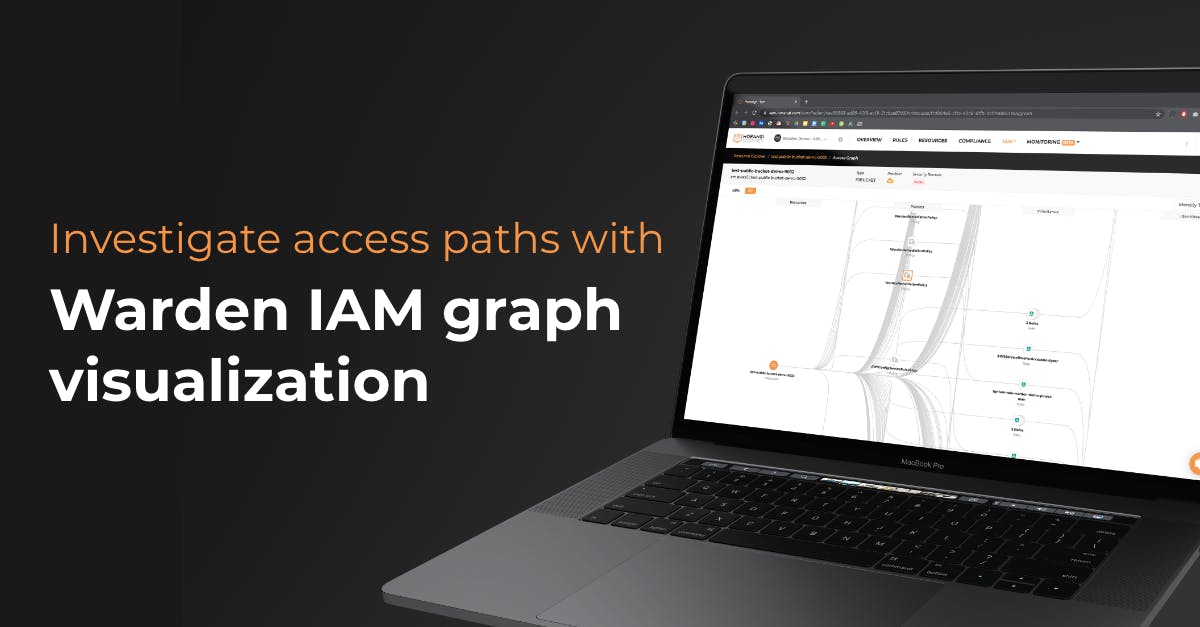
Warden IAM Graph Visualization
See it in action
Click on this link to see Warden IAM access graphs in action and how you can get unparalleled visibility on a unified dashboard to see broad-reaching access to your crown jewels.
Conclusion
Graphs equip cybersecurity professionals with the competitive edge of quick screening, enhanced turnaround time, high-quality recommendations, and minimal false positives, ultimately enabling them to alleviate cyber threats earlier. Consider implementing an all-in-one cloud security solution in your organization to make data analysis easier in threat detection and mitigation.
If you are having trouble answering “who has access to my crown jewels and how did they get the access?” then get in touch with a Horangi Specialist for a quick demo of Warden, a comprehensive cloud security tool with IAM, Threat Detection, and Posture Management capabilities.